Philosophy
Introduction - The origin and maintenance of biodiversity has been a long standing question among ecologists. One of the simplest ecological system where biodiversity emerges, and is stably maintained, is in populations of E. coli growing in a homogeneous environment limited by a single resource, usually glucose. The diversity is facilitated by cross-feeding (syntrophy), where one strain partially degrades the limiting resource into a secondary metabolite which is then utilised by a second strain. The platform Urdar is aimed at investigating the evolution of cross-feeding, but not in the context of a specific biological system, but instead we extract and analyse the general principles governing systems where cross-feeding might emerge.
Cross-feeding - The dynamics of cross-feeding can in
general terms be described by the figure below. 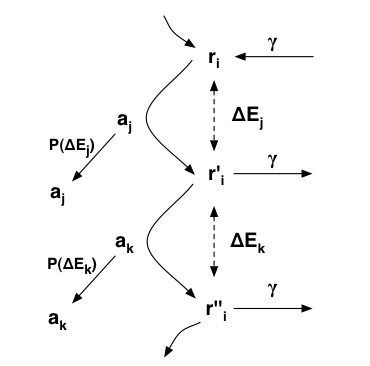
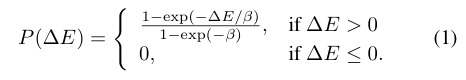
- The agents in the model digest binary strings by applying CA-rules, transforming r to r'. To each such metabolic step we can associate a difference in energy dE (visualised with dot- ted lines). The reproduction of each agent depends on how much it can decrease the energy of the binary string and oc- curs with probability P(dE) (represented by the arrows on the left hand side). The binary strings exist in a common pool which they enter (and leave) at a rate gamma, as shown by the arrows on the right hand side.
- This framework is very general and in Urdar we have made the following choices:
- (i) The agents a are chosen to be nearest-neighbour one-dimensional elementary cellular automata (CA), one of the simplest notions of digital algorithms.
- (ii) The metabolites r are taken to be binary strings
- (iii) The energy function E is taken to be an approximation of the Shannon entropy, which gives an estimate of the amount of disorder a binary string contains, associating a low entropy (low level of disorder) with a high "energy" state of the string, i.e. we set E = 1 - s.
Implementation - The dynamics, depicted schematically in the above figure, in the model during one update can be described in the following way:
Dynamics - The growth rate of a species (i.e. CA-rule) depends on how good it is at increasing the disorder of the food-strings in the resource pool. This in turn depends on the composition of the resources which is determined by the totality of species present in the system. Thus we see that the fitness of a species is not easily defined and is contingent on the ecosystem as a whole. This gives rise a large degree of species co-existence as can be seen in the applet.