 |
arn. |
POSIX Threads
In this assignment you are going to study an interesting mathematical and numerical problem.
Suppose that we would like to find approximations of the roots of the equation, x3 - 1 = 0. A standard way is to use Newton's method (which you should have seen in your numerical analysis course). So, in order to solve f(x) = 0, we form the iteration xk+1 = xk - f(xk) / f '(xk), where we start from x0 (which may be a guess, for example). In our example f(x) = x3 - 1. From the standard theory we know that the method converges to a root, provided x0 is close enough to the root (what "close enough" means is not easy to say). The method works in complex arithmetic as well. In the table below each column shows how the method behaves for our specific example and for a particular x0.
   4.0000            -2.0000 + 1.0000i  -2.0000 - 1.0000i  <-- the x0
   2.6875            -1.2933 + 0.7200i  -1.2933 - 0.7200i
   1.8378            -0.7821 + 0.6093i  -0.7821 - 0.6093i
   1.3239            -0.4384 + 0.7350i  -0.4384 - 0.7350i
   1.0728            -0.5085 + 0.8904i  -0.5085 - 0.8904i
   1.0048            -0.5001 + 0.8667i  -0.5001 - 0.8667i
   1.0000            -0.5000 + 0.8660i  -0.5000 - 0.8660i  <-- roots
Note that to compute a complex root, x0 must be complex. If we start far away, the method may converge, but we do not know to which root. It may also diverge, the xk may go to infinity (for a general function f), or we may get cycles (where values repeat), for example.
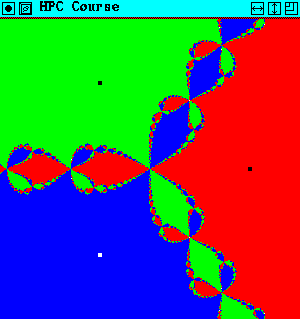
In the left plot below I have chosen x0 in the square ±1.5 ± 1.5 i, in the complex plane. I have marked each x0 according to which root Newton's method converges to (the roots are the black/white dots). If we start on any read dot we will come to the "red root" (the rightmost) etc.
 |
arn. |
In the right image I have marked, using colour, the number of iterations that are required for convergence. We note that the images show symmetries. Suppose we apply Newton's method to the problem xn - 1 = 0. Let r be one root of the equation. If x0 generates the sequence x1, x2, x3, ...then r x0 will generate the sequence r x1, r x2, r x3, ... which explains the symmetry (multiplying by r corresponds to a rotation). We can also see that the image must have the real axis as a symmetry line (there are only real coefficients in the iteration, for this specific example).
To make such an image we have to run Newton's method for each image point (pixel). The picture above is small, just 300 x 300 pixels. We would like to make larger images, say 900 x 900, which require almost one million Newton runs. Since each Newton run is independent from any other we can make the runs in parallel; the problem is embarrassingly parallel. Each thread could work with its one set of pixels. To get better graphics performance we will let each thread work with one line at a time. You should use the following dynamic load balancing algorithm. When a thread has finished computing a row it should take the next not already computed row, etc. The threads will be competing for rows, in other words. When a thread has computed its row, it should plot it (using the graphics package described below). We cannot expect to be able to plot simultaneously (the are multi threaded versions of X, but I have not used it) so some form of synchronization is necessary. So, we need two lock variables. One when a thread picks a new row to work with, and one for the plotting. A basic sketch of the algorithm may look like (each thread is doing this):
lock to update the shared row variable

  increase row by one

unlock
if we have not finished the whole image, run Newton's method
for each
pixel in the row
lock to be able to plot (a different lock variable)

  plot the row

unlock
A package for complex numbers.
You can fetch ~thomas/HPC/libcompgraph.so (on the
student system;
note not a www-address) containing the above routines.
Compile using the following sequence (provided libcomgraph.so
resides in your current directory):
cc your_program.c -L. -lcompgraph
-L/usr/X11R6/lib -lX11 -lpthread
-lm
You can of course link to ~thomas/HPC/libcompgraph.so
directly (provided you change the link-path. Another alternative
is to use a symbolic link.
The include file defs.h (and defs_cpp.h for C++).
Do not forget to include math.h if you
are using math-routines.
A note on void pointers (void *).
Now to the problem: write a C-program which computes and plots a picture like the one to the left above. The program should be parallel and use threads. Test it on the problem x3 - 1 = 0, and use the same intervals as above, i.e. -1.5 <= real(x0), imag(x0) <= 1.5.
You can, of course, improve this program if you like (zooming etc.) but that is not required.
If you like, you can start out with the program from the lecture.
Send me your
program by e-mail.