An
igloo problem
In this assignment you are going to use OpenDX to visualize (fake)
temperature in a volume (an igloo heated by a candle), using
isosurfaces and a cutting plane. This would be significantly harder to
do in Matlab since the coordinate data is
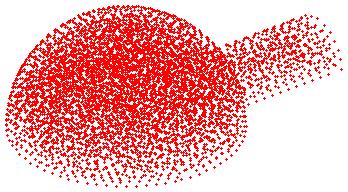
not regular. Here is an image showing all the 6501 points (but
no temperatures):
 On the file, igloo_data, there are 6501 rows
where each row contains a coordinate triple (x, y, z) and a
temperature. Use OpenDX to visualize the data in a good way. Your
program should be able to show glyphs, isosurfaces, a cutting plane or
a combination of isosurfaces and a cutting plane. The user should be
able to choose using radio buttons. One should be able to user
interactors to change the number of
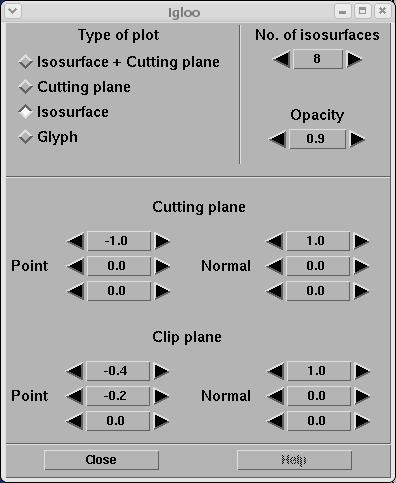
isosurfaces and the position of the cutting plane. There should be an
interactor to change the opacity (the opposite of transparency) as
well. There should be a clipping plane as well. This is what
the control panel may look like:
On the file, igloo_data, there are 6501 rows
where each row contains a coordinate triple (x, y, z) and a
temperature. Use OpenDX to visualize the data in a good way. Your
program should be able to show glyphs, isosurfaces, a cutting plane or
a combination of isosurfaces and a cutting plane. The user should be
able to choose using radio buttons. One should be able to user
interactors to change the number of
isosurfaces and the position of the cutting plane. There should be an
interactor to change the opacity (the opposite of transparency) as
well. There should be a clipping plane as well. This is what
the control panel may look like:
Hint: you must use the
AutoGrid-module to create a grid.