Some
problems from calculus
This set of problems is inspired from my course in calculus of
several variables (Sw. flervariabelanalys).
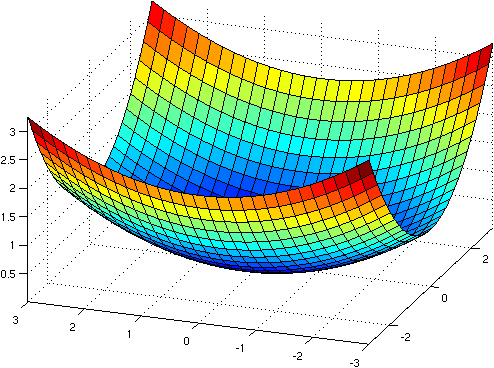
Let f(x, y) = x2 / 4 + y2
/ 9, a paraboloid, and suppose you want to draw part of f:s graph. This
is quite easy in Matlab, the following lines are sufficient (try them!):
[X, Y] =
meshgrid(linspace(-3, 3, 30));
surf(X, Y, X.^2 / 4
+ Y.^2 / 9)
grid on
axis equal
view([-70, 20])
This implies that the domain of the function, in the
image, is { (x, y) | -3 <= x, y <=3 }, so a
square.
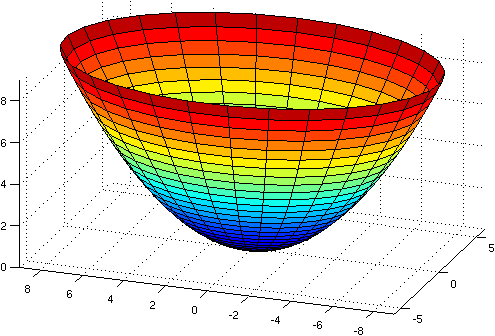
A more satisfactory rendition of the surface may be to draw the part of
the graph satisfying f(x, y) <= 3 (3 is arbitrary). This makes
the upper "edge" of the graph flat and it is easier to understand the properties of a paraboloid (I think).
The domain of the new function is D = { (x, y) | x2
/ 4 + y2 / 9 <=3 }, which is an
elliptical disk (a "filled" ellipse). There is a slight problem to draw the surface, since
Matlab is based on matrices, rectangles. The problem is solved by making a change of variables
(elliptical polar variables, Sw. elliptiskpolära koordinater): x = a r
cos v, y = b r sin v, where a = 2, b = 3 (in this example), 0 <=
r <= sqrt(3) (since f(x, y) <= 3). The angle v
satisfies 0 <= v <= 2 pi.
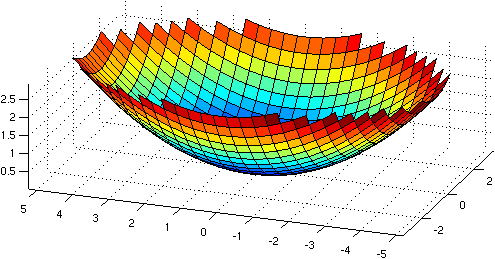
A bad way to draw the surface is to use masking with NaN:s (NaN = Not A Number),
since Matlab does not render NaN:s.
x_lim = sqrt(4 * 3);
y_lim = sqrt(9 * 3);
[X, Y] = meshgrid(linspace(-x_lim, x_lim, 30), linspace(-y_lim, y_lim, 30));
Z = X.^2 / 4 + Y.^2 / 9;
Z(Z > 3) = NaN;
surf(X, Y, Z)
grid on
axis equal
view([-70, 20])
By
increasing the resolution one can, of course, make the uneven edge look
less jagged. Using NaN:s is, however, a last resort and you should not use this trick in this lab (you can use it to test your solutions, however).
Now for the problems
 Use a suitable change of variables
to draw the graph of
Use a suitable change of variables
to draw the graph of
f(x, y) = exp( cos(x) sin(0.08 y) sqrt(1 - x2 / 2 - x - y2 / 3 + 2 y) )
on its maximal domain (the domain is limited due to the square root). Note that we are only interested in real values of x, y and f(x, y).
A problem with limits. The function f(x, y) = (x2 - y2) / (x2 + y2) does not have a limit when (x, y) -> (0, 0) (different paths to the origin may give different limits).
Illustrate the fact that f has no limit by creating a convincing plot.
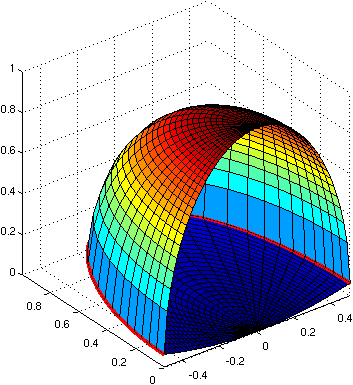
You should create an image to illustrate the set: { (x, y, z) | x2 / 4 + y2 / 9
<= z <= (1
- 4 x2 - y2)1/2, 0 <= y
}.
I want it drawn the following way:
Note the tight fit between the surfaces and the red curve which shows the intersection.
Hint:
try the following change of variables, x = r(v) cos v, y = r(v) sin v,
0 <= r(v). So similar to polar coordinates but where the radius, r,
is not constant but depends on the angle v.