Moving
curves
This lab is a simplified version of a real application I made. A
graduate student in physics needed a simple way to compare data from
experiments.
Each set of data consists of points along different curves. After
having plotted the curves, one can, using the mouse, drag a
curve to another location in
the plot. This makes it possible to put curves close to each other in
order to compare them (to compare the shape of peaks, for example).
Your program should be able to do at least the following (you can
make a fancy GUI if you like):
- The plot should be a log-log-plot.
- To move a curve, one should click on the curve, hold down the button, and then move the mouse.
The cursor should change to a hand-shape.
Using the mouse one should be able to move the curve to the desired
position.
The curve should seem to be attached to the mouse and follow the
movements of the mouse, in other words.
When one releases the button, the curve should remain in its present position and the
cursor should return to the normal arrow-shape.
- The axes should be steady and not jump around when a curve
is moved.
This implies that parts of a curve may sometimes be hidden (parts may
be outside the plot window).
- The curves should not change shape when you move them.
Hints: the following properties can be useful: the CurrentPoint-property
of the current axis, the Pointer-property of the
current figure.
axis manual
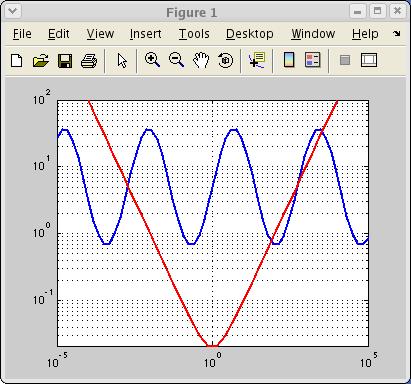
Here is some test-data for two curves (x1, y1)
and (x2, y2) (your program should work any number of curves and for any x, and y, with positive elements, however):
x1 = logspace(-5, 5, 60);
y1 = 5 * exp(2 * sin(log(x1)));
x2 = logspace(-4, 4, 30);
y2 = 1e-2 * (x2 + 1 ./ x2);
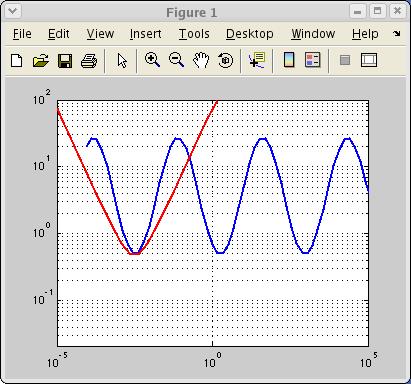
Here are two small images. The left shows the original
position of the curves and in the right the curves have been moved.
November 21, 2012:
One student noticed that the WindowButtonMotionFcn does not behave properly. It says in the documentation that:
Mouse motion callback function. Executes whenever you move the pointer within the figure window.
As it turns out, the callback executes outside the window provided you hold down a mouse button.
So,
if a user of your program should not be able to move the curve
(completely) outside the axis-limits you can compare the currentpoint
data with the axis and not move the curve too far.