 The binary mat-file,
igloo_data.mat,
contains three variables,
nodes,
temp and
tetra.
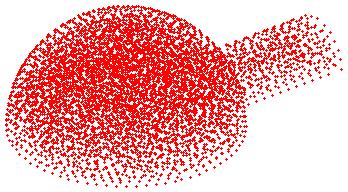
nodes is a 6501x3-matrix containing the
xyz-coordinates for the points, each row describes one point.
temp
is a 6501x1-vector containing the corresponding temperatures.
The points are vertices of a set of 33696 tetrahedrons (you need the tetrahedrons
to visualize the data in the way I want).
The coordinates of the vertices are given indirectly;
each row in the 33696x4-matrix tetra
contains four integers which are indices (pointers) into the nodes-matrix.
The binary mat-file,
igloo_data.mat,
contains three variables,
nodes,
temp and
tetra.
nodes is a 6501x3-matrix containing the
xyz-coordinates for the points, each row describes one point.
temp
is a 6501x1-vector containing the corresponding temperatures.
The points are vertices of a set of 33696 tetrahedrons (you need the tetrahedrons
to visualize the data in the way I want).
The coordinates of the vertices are given indirectly;
each row in the 33696x4-matrix tetra
contains four integers which are indices (pointers) into the nodes-matrix.
Use ParaView to visualize the data in a good way. Try
using glyphs, isosurfaces, clipping and slicing planes etc. Create
a suitable input file using Matlab.
